

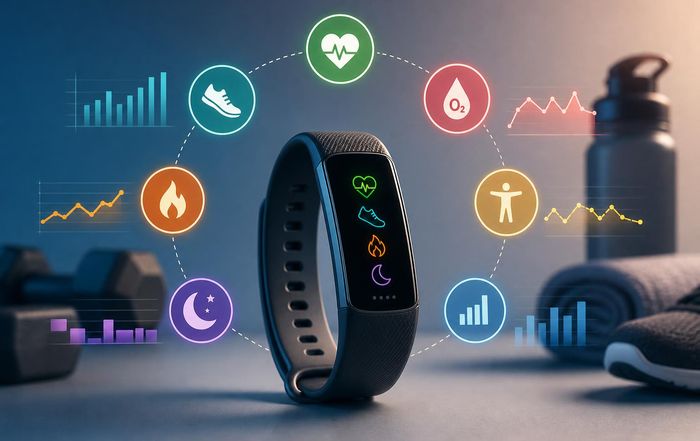
Which Fitness Tracking Metrics Actually Matter Most?
The explosion of wearables, training apps, and smart gym equipment means most active people are now swimming in data. Steps, VO₂ max, HRV, readiness scores, sleep stages, "body battery," training load, stress, blood oxygen, cadence, power-it can feel like a full-time job just to make sense of it all. Yet for performance, health, and day-to-day training decisions, only a handful of metrics consistently deliver real value. The challenge is knowing which numbers to focus on, how to interpret them, and when to ignore the noise.
This fit media breaks down the fitness tracking metrics that matter most for a modern, active lifestyle, and how to prioritize them whether you are chasing a marathon PR, building strength, or simply trying to feel and function better. It also looks at where the science is strong, where it is still evolving, and how to avoid letting your devices dictate your training instead of supporting it.
Start with purpose: what are you actually trying to achieve?
Before deciding which metrics matter, it is essential to clarify what "better" means for you. A recreational runner trying to finish their first 10K, a powerlifter aiming to add 20 kg to their squat, and someone returning from burnout all need different feedback from their devices. Without a clear purpose, people often chase whatever number their watch highlights-closing rings, chasing readiness scores, or obsessing over sleep stages-rather than metrics that truly relate to their goals. Sports scientists at organizations such as World Athletics and World Rowing increasingly emphasize "decision-useful" data: numbers that change what you do today or how you plan the next few weeks. For most athletes and fitness enthusiasts, that means focusing on a core group of metrics around workload, cardiovascular response, recovery, and long-term progress, while treating everything else as optional detail rather than a performance verdict.
The foundation: activity volume and consistency
For general health, weight management, and baseline fitness, the single most important metric is not exotic at all: total activity volume over time. Public health guidelines from bodies like the World Health Organization and the U.S. Centers for Disease Control and Prevention recommend at least 150-300 minutes of moderate-intensity or 75-150 minutes of vigorous-intensity activity per week, plus muscle-strengthening work on two or more days. Whether you track that via step counts, active minutes, training volume in your app, or time-in-zone during workouts, the key insight is that regular movement beats sporadic hero sessions.
Steps can be a useful proxy for daily movement, especially for less structured exercisers, but the popular 10,000-step target is more cultural than scientific. Large cohort studies suggest that health benefits start to level off somewhere between roughly 7,000 and 10,000 steps per day for many adults, with older adults often seeing meaningful gains at lower thresholds. What matters more than hitting a magic number is raising your personal baseline: if you average 4,000 steps, getting to 6,000-7,000 consistently is a significant win. For readers who prefer structured training, looking at weekly training load-such as total running kilometers, cycling hours, or total sets and reps in the gym-gives a clearer picture than steps alone and aligns better with performance goals.
For people trying to build sustainable habits, tracking streaks and consistency can be powerful but also risky if it becomes obsessive. Fitness apps and wearables often gamify this, but missing one day is not a crisis and should not trigger "all or nothing" thinking. A more performance-aligned approach is to review your weekly and monthly activity totals, adjust for life stress and recovery, and see whether you are trending in the direction that supports your goals. For those interested in building better routines, exploring structured guidance in areas like training and lifestyle can help turn raw activity data into habits.
Heart rate: the everyday workhorse metric
Heart rate is one of the most widely used and practically useful metrics in fitness tracking, but only when interpreted in context. During exercise, heart rate zones can help gauge intensity when power meters or lab testing are not available. While different brands use slightly different zone models, the basic idea is similar: lower zones for easy aerobic work, middle zones for tempo and threshold, and higher zones for high-intensity intervals. For endurance athletes, most training should still sit in the easy-to-moderate range, a principle supported by research from groups like the American College of Sports Medicine and endurance-focused institutes such as INSEP in France and Australian Institute of Sport. If your data shows most of your weekly volume happening in the very high heart rate zones, you may be training too hard too often, which can increase injury and burnout risk.
Resting heart rate (RHR) is also a valuable long-term indicator. A lower RHR over months often reflects improved cardiovascular fitness, while sudden spikes can signal illness, accumulated fatigue, or stress. However, it is normal for RHR to fluctuate day to day based on sleep, caffeine, hydration, and emotional stress. Rather than reacting to a single high reading, it is more informative to watch rolling averages over one to two weeks. Many wearables now estimate heart rate 24/7, and while wrist-based sensors can be imperfect, trends are usually reliable enough for practical decisions. For readers focused on performance, combining heart rate with perceived exertion and training logs-something sports scientists at organizations like UK Sport and Sport Australia consistently advocate-gives a more complete picture than any single number.
VO₂ max estimates: useful trend, not a verdict on your fitness
VO₂ max, the maximum rate at which your body can use oxygen during intense exercise, is a classic marker of aerobic capacity. Laboratory tests remain the gold standard, typically conducted on treadmills or cycle ergometers with gas analysis. Wearables and fitness apps increasingly estimate VO₂ max using heart rate and pace data from runs, rides, or even walks. Companies like Garmin, Polar, and Apple all offer such estimates, often drawing on algorithms from research groups like Firstbeat. These estimates can be directionally helpful, but they come with important caveats.
First, VO₂ max is just one component of performance. Race times, functional fitness, and real-world performance also depend heavily on running economy, technique, strength, tactical pacing, and psychological factors. Two athletes with identical VO₂ max values can perform very differently. Second, watch-based VO₂ max numbers are sensitive to input quality: poor GPS accuracy, irregular pacing, or heart rate sensor errors can skew results. Third, VO₂ max naturally changes with training phase, age, and life circumstances. A drop during a recovery block or stressful period does not necessarily mean you are losing meaningful fitness; it may reflect temporary fatigue or lower-intensity training.
Where VO₂ max estimates shine is as a long-term trend indicator rather than a daily score to obsess over. If your estimated VO₂ max is rising gradually over months while you maintain or improve your training quality, that is a positive signal. If it stagnates or declines despite consistent, well-structured training, it may be a prompt to review your program, recovery, or lifestyle factors like sleep and nutrition. Endurance-focused readers might combine VO₂ max trends with other performance metrics and explore more detailed performance content in areas like sports and performance.
Heart rate variability (HRV) and readiness scores: promising but nuanced
Heart rate variability, the variation in time between heartbeats, has become one of the most talked-about recovery metrics in recent years. Higher HRV is generally associated with better parasympathetic (rest-and-digest) activity and resilience, while lower HRV can signal stress, fatigue, or illness. Companies like Whoop, Oura, and Apple have popularized HRV-based readiness or recovery scores that aim to summarize how prepared your body is for training on a given day. Researchers in sports science and autonomic physiology, including groups at Stanford University, University of Copenhagen, and University of Queensland, have produced a growing body of work supporting HRV's value for monitoring training load and recovery-when used appropriately.
The key is to focus on your own baseline and trends rather than comparing raw numbers with others or reacting to single-day dips. HRV is highly individual and influenced by genetics, age, sex, breathing patterns, alcohol intake, mental stress, and even meal timing. Good systems look at rolling averages and changes relative to your normal range, not absolute values. A consistently suppressed HRV over several days, especially if combined with higher resting heart rate and poor sleep, may suggest that you are under-recovered and should adjust intensity. However, HRV is not a perfect oracle. Some people see large day-to-day swings with no clear performance impact, and high-performing athletes sometimes show lower HRV during heavy but well-managed training blocks without negative consequences.
Readiness scores try to simplify all this into a single decision-support number by combining HRV, sleep, recent training load, and sometimes respiratory rate or skin temperature. These can be useful prompts but should not override subjective signals like mood, muscle soreness, and motivation. If your readiness score is low but you feel good and your long-term plan calls for a key session, it may still be appropriate to train, perhaps with a little extra attention to warm-up and technique. Conversely, if your device says you are "ready" but you feel exhausted, listening to your body is usually wiser. For those interested in the intersection of physiology, tech, and training decisions, exploring technology and health coverage can provide deeper context on how these metrics are evolving.
Sleep metrics: prioritize duration, regularity, and quality basics
Sleep tracking has advanced rapidly, with many devices now offering estimates of sleep stages, disturbances, and overnight movement. Research from institutions like Harvard Medical School, University of Oxford, and Karolinska Institutet consistently emphasizes that for health, performance, and recovery, the most important sleep metrics are still straightforward: total sleep duration, sleep regularity (consistent bed and wake times), and subjective sleep quality. Most adults perform best with roughly seven to nine hours per night, though individual needs vary. Chronic short sleep is linked with impaired performance, higher injury risk, and poorer metabolic and mental health.
Sleep-stage breakdowns (REM, deep, light) are interesting but currently less reliable on consumer devices. Validation studies indicate that while some wearables can reasonably estimate total sleep time and general wake periods, their ability to distinguish specific sleep stages is limited compared with polysomnography, the clinical gold standard. Over-focusing on these stage graphs can lead to "orthosomnia," where people become anxious about achieving perfect sleep metrics, which ironically can worsen sleep. For most active people, it is more productive to track bed and wake times, total time asleep, and simple quality markers such as how refreshed they feel, rather than agonize over whether they had enough deep sleep according to their watch.
Sleep scores, like readiness scores, can be a helpful summary, especially when viewed over weeks. A run of low sleep scores combined with heavy training and life stress may suggest dialing back intensity temporarily. But a single bad night before an important workout or competition is not usually catastrophic; research in elite sport settings, including work supported by organizations like FIFA and IOC, indicates that short-term sleep disruption often has less impact than people expect, especially when overall sleep over the preceding week has been adequate. For more on how sleep interacts with training and recovery, readers can explore fitness and world coverage on evolving global approaches to athlete care.
Strength and performance metrics: what lifters and team-sport athletes should track
Many mainstream wearables are biased toward steps and endurance metrics, but for strength training, team sports, and mixed-modal training like CrossFit, other metrics can be more useful. At the simplest level, tracking the loads you lift, the number of sets and reps, and the main exercises you perform over time is crucial. Progressive overload-gradually increasing the challenge through more weight, more volume, more speed, or more complexity-is the cornerstone of strength and hypertrophy. Logging sessions in a training app or notebook often provides more actionable insight than any watch-based score: you can see when lifts plateau, where you are progressing, and which movements you are neglecting.
Velocity-based training (VBT), which uses devices or bar sensors to measure how fast you move a given load, is gaining popularity from elite settings into serious amateur gyms. Research from groups such as Spanish National Sports Council and universities including Universidad de Granada suggests that rep velocity can help optimize load selection, manage fatigue, and individualize training zones. However, VBT equipment and interpretation still require some expertise, and for most recreational lifters, tracking estimated one-rep maxes, rep quality, and session difficulty ratings (RPE, or rate of perceived exertion) is more practical. In team sports, GPS and inertial sensors now track sprint distances, accelerations, and high-intensity efforts. Clubs and national federations-like those under UEFA or World Rugby-use these metrics to manage training load, reduce injury risk, and tailor conditioning. For everyday players, simplified versions of these metrics (total distance, sprint count, time at high speed) can still be informative, especially across a season.
For athletes and enthusiasts who blend strength and endurance, the most meaningful performance metrics often include event-specific tests: 5K times, 1RM lifts, time to complete a specific workout, or repeated-sprint performance. These benchmarks provide a reality check on whether the metrics on your watch translate into better real-world performance. They are also a reminder that the ultimate "metric that matters" is often how well you can execute in your chosen sport, something that readers can explore further in sports and training coverage.
Body composition, weight, and the risk of over-tracking
Many devices and smart scales now estimate body fat percentage, muscle mass, and other body composition measures using bioelectrical impedance. While these can be useful for long-term trends, their day-to-day precision is limited and heavily influenced by hydration status, recent meals, and even skin temperature. Major medical and sports organizations, including the World Obesity Federation and American Heart Association, increasingly emphasize that health and performance are not determined solely by weight or body fat percentage. Over-focusing on these numbers can fuel unhealthy behaviors, especially in aesthetic or weight-class sports.
For most active adults, it is more productive to track how they feel, how clothes fit, how they perform, and perhaps simple circumference measurements (waist, hips, thighs) alongside periodic weight checks, rather than weighing in multiple times per day. If body composition is a key goal, consistency in measurement conditions-same time of day, similar hydration, same device-is crucial to make sense of trends. At the same time, it is important to acknowledge that for some people, frequent tracking of weight or body composition can aggravate body image issues or disordered eating patterns. In those cases, working with qualified professionals and focusing on performance, strength, and energy levels rather than scale metrics may be healthier. Readers who want to explore ethical and social aspects of tracking and body image can find more discussion in ethics and culture coverage.
Training load and acute-chronic ratios: helpful guardrails, not strict rules
Concepts like training load, acute-chronic workload ratios, and "strain" scores aim to quantify how much stress you are placing on your body over different time scales. Platforms like TrainingPeaks, Strava, and Garmin Connect use variations of these ideas, often drawing on research from sports science groups associated with organizations such as Aspetar, AIS, and various university labs. While exact formulas vary, the central idea is that sudden spikes in training relative to what you are used to can increase injury and illness risk, whereas gradual, progressive increases build resilience.
These models can be useful guardrails, especially for endurance athletes ramping up toward events. If your weekly training load jumps by 40-50% compared with your recent average, that is a red flag regardless of what your watch calls the ratio. But these metrics are only as good as the data going in, and they cannot fully account for non-training stressors like work pressure, travel, or family responsibilities. They also do not capture technique quality, biomechanics, or sport-specific risk factors. Treating training load numbers as one input among several-alongside subjective fatigue, soreness, mood, and sleep-aligns more closely with how high-performance environments now operate.
For recreational and semi-competitive athletes, a practical approach is to review weekly and monthly training summaries, check whether volume and intensity are rising at a sustainable pace, and adjust when spikes or persistent fatigue appear. Training platforms and wearables often present this visually, and combining those graphics with your own training diary notes can be more powerful than any single index. Readers interested in the broader business and tech side of training platforms and data analytics can explore related topics in business and technology.
Metrics that matter less (or only for specific situations)
Not every metric your device offers deserves equal attention. For many active people, numbers like blood oxygen saturation (SpO₂), respiratory rate, and detailed stress scores have limited day-to-day utility unless there is a specific clinical or performance reason to monitor them. At sea level in healthy individuals, SpO₂ is typically high and stable; it becomes more relevant at altitude, in certain respiratory conditions, or for specialized sports like high-altitude mountaineering. Respiratory rate and skin temperature can sometimes provide early clues of illness or overtraining, but the science of using them in consumer wearables is still developing, and false alarms are common.
Similarly, some proprietary "body battery," "energy," or "fatigue" scores combine multiple inputs into a single number but may lack transparency about how they are calculated. While they can be directionally informative, they should not override more established markers like sleep duration, resting heart rate, HRV trends, and your own perception of fatigue. Gamified metrics such as streaks, badges, and monthly challenges can be motivating tools, especially for building habits, but they are not measures of fitness or health in themselves. The risk is letting these badges drive behavior to the point where rest days feel like failures rather than essential components of training. For people who enjoy the cultural and gaming aspects of fitness tech, there is rich crossover with gaming and social reporting on how competition and community shape behavior.
Turning numbers into better decisions
Ultimately, the metrics that matter most are those that help you make better choices: when to push, when to back off, how to structure your weeks, and whether your training is moving you toward your goals. A practical hierarchy for many active people looks something like this: at the base, overall activity volume and consistency; then heart rate and perceived exertion to guide intensity; then sleep duration and regularity to support recovery; then HRV, readiness, and training load as secondary checks; and finally performance benchmarks-race times, strength numbers, or sport-specific tests-as the real-world proof of progress.
The art is in combining objective data with subjective experience. Sports scientists at leading institutions and organizations such as International Olympic Committee, FIFA, and national high-performance centers repeatedly emphasize that athlete self-report-how they feel, how hard sessions seem, their mood and motivation-is as important as sensor data. For everyday athletes, that means treating devices as advisors, not dictators. If your metrics suggest you are under-recovered, but you have a low-stakes session planned and feel fine, you might proceed but keep it truly easy. If your data looks "good" but you feel unusually flat and unmotivated, it may be wise to take a lighter day.
Over time, the most valuable outcome of fitness tracking is not perfect numbers but better self-awareness: understanding how your body responds to different types of training, stress, sleep, and nutrition. When the data helps you recognize those patterns and adjust accordingly, it is doing its job. When it becomes a source of anxiety or confusion, it may be time to simplify-focus on a few core metrics, review them regularly but not obsessively, and let your sport, your goals, and your lived experience lead the way.